


Banking Giants Beat Expectations: Q3 Earnings Review
Goldman Sachs, Bank of America, Citigroup and Walls Fargo Q3 Earnings Review


Introduction
To approach reading this article, let's briefly recap how commercial banks and investment banks make money in relation to interest rates, the concept of stickiness and the role of the FED: understanding these elements provides essential context for analyzing the recent financial results reported by banks and sets the stage for what to expect in the final quarter and the coming year.
Commercial and Investment Banks
Commercial Banks primarily earn through the interest rate spread (the difference between the rates they charge on loans and what they pay on deposits). Higher interest rates generally benefit commercial banks, as they can increase loan rates more easily, while deposit rates tend to rise more slowly, allowing for a wider profit margin. However, when interest rates fall, banks may have to lower their loan rates to stay competitive, which can shrink their margins.
Investment Banks, on the other hand, thrive in a low-interest-rate environment. Lower rates result in higher valuations for companies (due to a lower discount rate in valuation models like Discounted Cash Flow), which boosts activities like mergers and acquisitions (M&A) and equity capital market (ECM) operations. These generate more fees for investment banks. Additionally, low rates can drive market euphoria, increasing demand for capital market transactions and trading activities.
The Concept of Stickiness
The concept of “stickiness” refers to the delayed response of banks in adjusting the rates they offer to customers, especially on deposits. When market rates rise, banks tend not to immediately raise deposit rates to maintain wider margins. Conversely, when rates fall, banks aim to lower loan and deposit rates quickly to limit the impact on their margins.
The speed at which changes in interest rates affect various banks largely depends on their balance sheet composition, as well as the relative stickiness of their assets and liabilities, and their approach to managing interest rate risk. Effective risk management strategies can help mitigate the negative impact of rapid rate fluctuations on net interest margins.
In general, commercial and investments banks tend to be influenced by interest rate levels in opposite ways as said before. Consequently, banks that operate in both areas often experince less volatility in their financial results compared to thos that concentrate solesy on either commercial o investment banking.
Fed’s Monetary Policy
The Federal Reserve (Fed), the central bank of the United States, has progressively raised interest rates in recent years to combat high inflation. Currently, the Fed is transitioning toward a more neutral monetary policy, aiming to stabilize rates around 3%. This level is considered a "neutral" rate, meaning it neither stimulates nor slows down the economy.
The Fed's next meeting, scheduled for November 7, 2024, will be crucial in determining the future direction of interest rates. The latest inflation data (CPI) exceeded expectations, suggesting persistent inflationary pressures, with the index coming in above the forecasted 2.3%.
Recent Macroeconomic Indicators
Employment: the latest U.S. jobs report showed an increase in employment, signaling a resilient labor market. However, too rapid job growth could sustain wage inflation, complicating the Fed's efforts to bring inflation down.
Exogenous Factors: events like the recent hurricane and port workers' strikes have introduced additional disruptions to supply chains, with potential short-term economic impacts. Such events could complicate the Fed’s task of assessing economic conditions, as they are likely to distort the data in the upcoming jobs report. Temporary shifts in employment and productivity due to these circumstances may obscure underlying trends, making it harder for the Fed to gauge the true state of the labor market.
Goldman Sachs
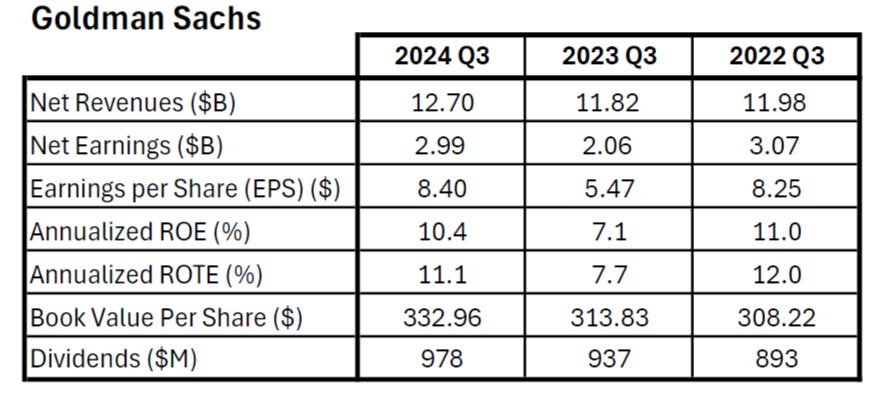
Goldman Sachs posted a robust 45% increase in profit for Q3 2024, signaling strong performance across its core Wall Street-focused businesses, particularly in investment banking and asset and wealth management. The bank reported net earnings of $2.99 billion, equating to an earnings per share (EPS) of $8.40, surpassing market expectations. Total revenue for the quarter increased by 7% year-over-year to $12.7 billion.
Key Financial Highlights:
Revenue Growth: Goldman’s overall revenue rose 7% YoY to $12.7 billion, driven primarily by strong performances in investment banking and asset and wealth management.
Investment Banking: investment banking fees surged by 20% YoY, with a total of $1.87 billion in revenue, marking the third consecutive quarter of growth. This was fueled by notable increases in debt and equity underwriting.
Asset and Wealth Management: this division saw a 16% increase in revenues YoY, generating $3.75 billion. Notably, management and other fees hit a record $2.62 billion, as the firm continues to focus on steady fee streams from institutional clients.
Trading Revenue: trading revenues were up slightly to $6.46 billion, with growth driven by an increase in equities and institutional lending. Fixed Income, Currencies, and Commodities (FICC) financing revenue also saw a 30% YoY increase.
Strategic Shift and Market Context:
Goldman Sachs has been undergoing a significant strategic transformation, shifting away from consumer lending, where it has faced losses, and doubling down on its core Wall Street activities. This shift is evident in the decision to exit its credit card partnership with General Motors and the planned sale of its consumer-lending business. These moves have resulted in a $415 million pretax hit for Q3 2024, as the bank prepares to refocus resources on dealmaking, trading, and wealth management.
The investment banking landscape has been buoyed by lower interest rates, which Goldman and other banks see as a catalyst for dealmaking. While not at 2021 levels, M&A activity has picked up, supported by improved CEO confidence and cooling inflation. Global M&A volume reached $909 billion in Q3 2024, up from $744.6 billion the prior year.
Moreover, the bank is also expecting a potential loss from the sale of its partnership with Apple, where credit card balances stand at $17 billion.

Bank of America
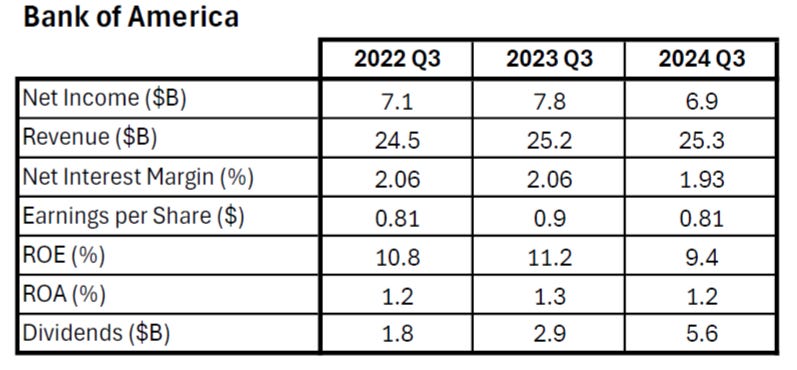
Bank of America reported a robust third-quarter performance, exceeding analyst expectations for both profit and revenue, driven by stronger-than-anticipated trading results. Net income for the quarter was $6.9 billion, or $0.81 per share, surpassing the $0.77 per share estimate by LSEG. However, this marked a 12% decline from the previous year, primarily due to higher provisions for loan losses and rising expenses.
Key Financial Highlights:
Total Revenue: Bank of America reported revenue of $25.49 billion, slightly exceeding analyst expectations of $25.3 billion. Revenue grew less than 1% year-over-year, driven by gains in trading revenue, asset management, and investment banking fees, which offset a decline in net interest income.
Net Interest Income: the bank’s net interest income fell 2.9% to $14.1 billion, slightly above the $14.06 billion estimate. This decline was a result of higher deposit costs, though the figure marked an improvement over Q2 2024.
Credit Loss Provisions: the provision for credit losses stood at $1.5 billion, slightly below the $1.57 billion estimate.
Segment Performance:
Trading Revenues: the bank saw strong performance in its trading division. Fixed income trading revenue rose 8% year-over-year to $2.9 billion, topping the $2.74 billion StreetAccount estimate. This was driven by strength in currencies and interest rate activity. Equities trading jumped 18% to $2.0 billion, beating estimates of $1.81 billion, as higher cash and derivatives volumes bolstered results.
Investment Banking: investment banking fees surged 18% year-over-year to $1.4 billion, exceeding expectations of $1.27 billion.
Global Wealth and Investment Management: posted an 8% increase in revenue to $5.8 billion, primarily driven by higher asset management fees and increased client balances, which reached $4.2 trillion.
Global Banking: the segment recorded net income of $1.9 billion, benefiting from its strong investment banking and lending operations.
Market Context and Strategy:
Bank of America, led by CEO Brian Moynihan since 2010, showcased the benefits of its diversified financial model. While rising interest rates have squeezed net interest income from traditional banking activities such as taking in deposits and lending, Bank of America has offset this pressure with strong gains in its trading and advisory businesses. Similar to JPMorgan Chase and Goldman Sachs, the bank benefited from increased Wall Street activity.

Citigroup
Citigroup exceeded Wall Street expectations in its third-quarter results, with growth driven by investment banking and wealth management. The bank reported earnings per share of $1.51, surpassing the $1.31 estimate by LSEG, despite a decline in net income compared to the previous year. Citi posted a net income of $3.2 billion, down from $3.5 billion in Q3 2023, primarily due to higher provisions for credit losses. Total revenue rose slightly to $20.32 billion, beating the $19.84 billion forecast.
Key Financial Highlights:
Total Revenue: Citi reported total revenues of $20.32 billion, an increase of 1% year-over-year, driven by strong growth in investment banking and wealth management. The revenue exceeded the $19.84 billion analyst estimate.
Net Interest Income: Citi’s net interest income declined 3% YoY to $13.4 billion due to margin compression, although it still slightly edged out market estimates.
Credit Loss Provisions: Citi set aside $315 million to offset potential loan losses, contributing to an overall provision for credit losses of $2.7 billion.
Segment Performance:
Investment Banking: Investment banking revenue surged 31% YoY, reaching $934 million, driven primarily by robust growth in investment-grade debt issuance. Total banking revenue increased 16% YoY to $1.6 billion.
Wealth Management: Citi's wealth management division saw a 9% increase in revenues, reaching $2.0 billion. This was primarily driven by a 15% rise in non-interest revenue, reflecting strong momentum in client investment assets.
Equities Trading: Citi’s equity markets revenue jumped 32% YoY, reaching $1.2 billion. This growth was fueled by strong performance in prime services, equity derivatives, and cash equity volumes.
Fixed Income Trading: While equities trading saw substantial growth, fixed income trading revenue dipped 6% YoY to $3.6 billion, reflecting a challenging comparison to strong performance in the previous year.
Strategic Initiatives and CEO Commentary:
CEO Jane Fraser emphasized that the results demonstrate significant progress in Citi’s transformation strategy. The bank’s efforts to streamline its operations have resulted in a 2% reduction in operating expenses YoY, despite continued investments in areas such as technology and risk management. Fraser also highlighted several key milestones, including the launch of a new cross-border payments capability with Mastercard and a $25 billion private credit partnership with Apollo.


Wells Fargo
Wells Fargo reported a decline in net income for Q3 2024, as rising funding costs for customer deposits impacted profitability. The bank’s net income fell by 11% year-over-year to $5.11 billion, or $1.42 per share, beating analysts' estimates despite challenges from higher interest rates and customer migration to higher-yield accounts. Revenue for the quarter decreased slightly by 2% to $20.37 billion.
Key Financial Highlights:
Total Revenue: Wells Fargo’s total revenue decreased by 2% year-over-year to $20.37 billion, reflecting challenges in net interest income as customers shifted to higher-yielding accounts.
Net Income: The bank posted net income of $5.11 billion, down 11% from $5.77 billion in the same quarter of 2023.
Earnings per Share: Wells Fargo reported earnings per share of $1.42, down from $1.48 in Q3 2023, but above analyst expectations.
Net Interest Income: The bank saw an 11% decline in net interest income to $11.69 billion, driven by higher funding costs as customers moved to higher-yielding deposit products.
Noninterest Income: Noninterest income increased by 12% to $8.68 billion, supported by gains from trading activities, venture capital investments, and higher asset-based fees in the Wealth and Investment Management segment.
Provision for Credit Losses: The bank set aside $1.07 billion for credit losses, an 11% decrease compared to the prior year.
Strategic Moves:
Wells Fargo repositioned its investment securities portfolio during the quarter, resulting in a $447 million loss. The strategy is part of a broader plan to sell lower-yielding securities and reinvest in higher-yielding alternatives.
Stock Performance:
Despite the mixed earnings report, Wells Fargo’s stock surged 6.2% during afternoon trading, outperforming the broader KBW Bank Index, which rose 3%. Investors appeared optimistic about the bank’s future outlook and strategic repositioning.


References:
Goldman Sachs Quarterly Earnings
Bank of America Quarterly Results
Quarterly Earnings Releases and Supplements